Midtown Toronto Apartment Market Report: Average Rent by Square Footage and Amenities (March 2026)
Our research team compiled data from unique sources to produce this Midtown Toronto apartment market report as of March 2026. Data was aggregated from the Canada Mortgage and Housing Corporation (CMHC), Rentals.ca, Zumper, the Toronto Regional Real Estate Board (TRREB), Statistics Canada, the City of Toronto, and proprietary research conducted by The Benvenuto Group. The report covers the purpose-built rental market in Midtown Toronto, with a focus on the Yonge-Eglinton corridor and surrounding neighborhoods including Mount Pleasant West, Davisville Village, and Deer Park.
The following sections break down average rents by suite type, rent per square foot by neighborhood, the amenity premium in Midtown rental buildings, vacancy rate trends, and the key demand drivers shaping the corridor in 2026.
Average Rent by Suite Type in Midtown Toronto: March 2026
Average rents across all suite types in Midtown Toronto declined year-over-year, consistent with broader GTA trends. Data is compiled from CMHC, Rentals.ca, and Zumper listings as of March 2026.
| Suite Type | Average Rent (Midtown Toronto) | Average Suite Size | Rent per Sq. Ft. | Year-over-Year Change |
| Studio / Bachelor | $1,847 | 418 sq. ft. | $4.42 | -4.3% |
| 1-Bedroom | $2,274 | 583 sq. ft. | $3.90 | -5.1% |
| 1-Bedroom + Den | $2,516 | 647 sq. ft. | $3.89 | -4.7% |
| 2-Bedroom | $3,148 | 812 sq. ft. | $3.88 | -3.2% |
| 3-Bedroom | $4,271 | 1,087 sq. ft. | $3.93 | -1.8% |
Average rents in Midtown Toronto declined across all suite types year-over-year, consistent with broader trends across the Greater Toronto Area.
- CMHC reported the GTA’s purpose-built vacancy rate climbed to 3% in 2025, the highest level since the pandemic, driven by declining immigration, reduced international student demand, and economic uncertainty tied to trade tariffs
- Rentals.ca reported Toronto asking rents fell to a 33-month low in February 2026, with the national average asking rent down 2.8% year-over-year to $2,030
- Studio and 1-bedroom units saw the steepest drops as new condo and purpose-built supply entered the market simultaneously
- Larger units held up better, 2- and 3-bedroom rents declined the least, supported by steady demand from downsizers, families, and shared living arrangements
- TRREB reported GTA condo rental transactions grew 16% year-over-year in Q4 2025 while average rents declined, confirming increased tenant mobility and negotiating power
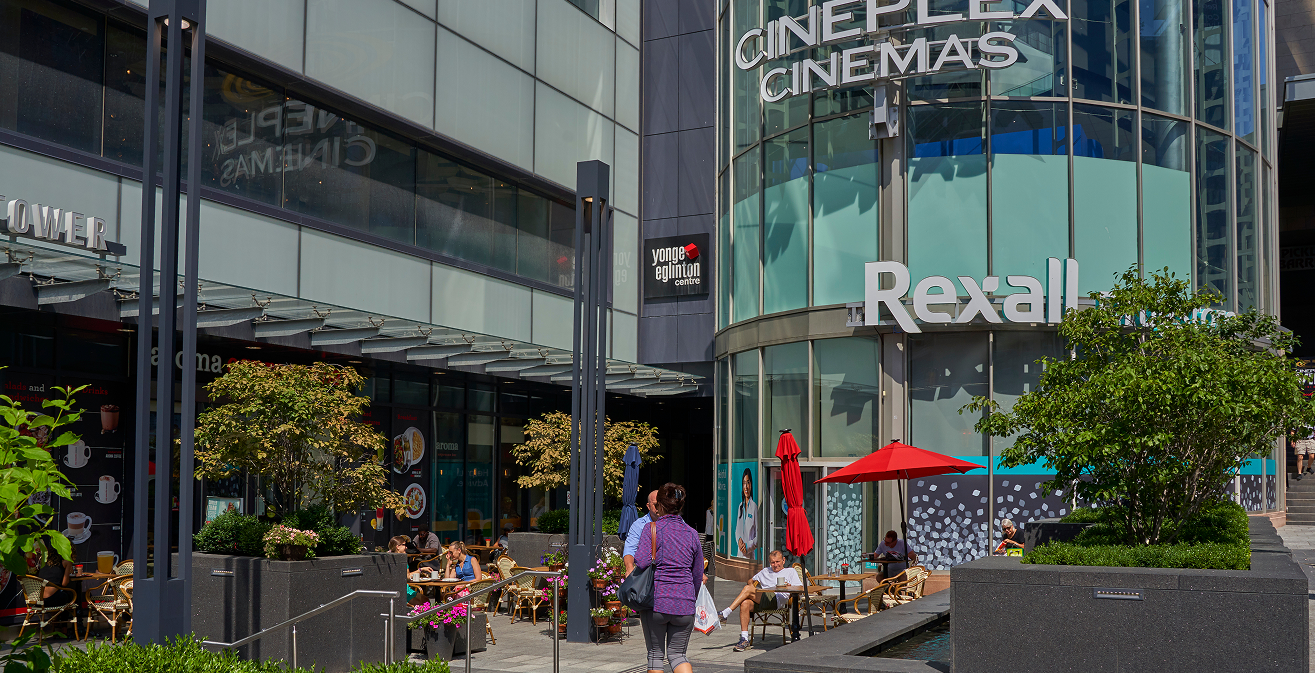
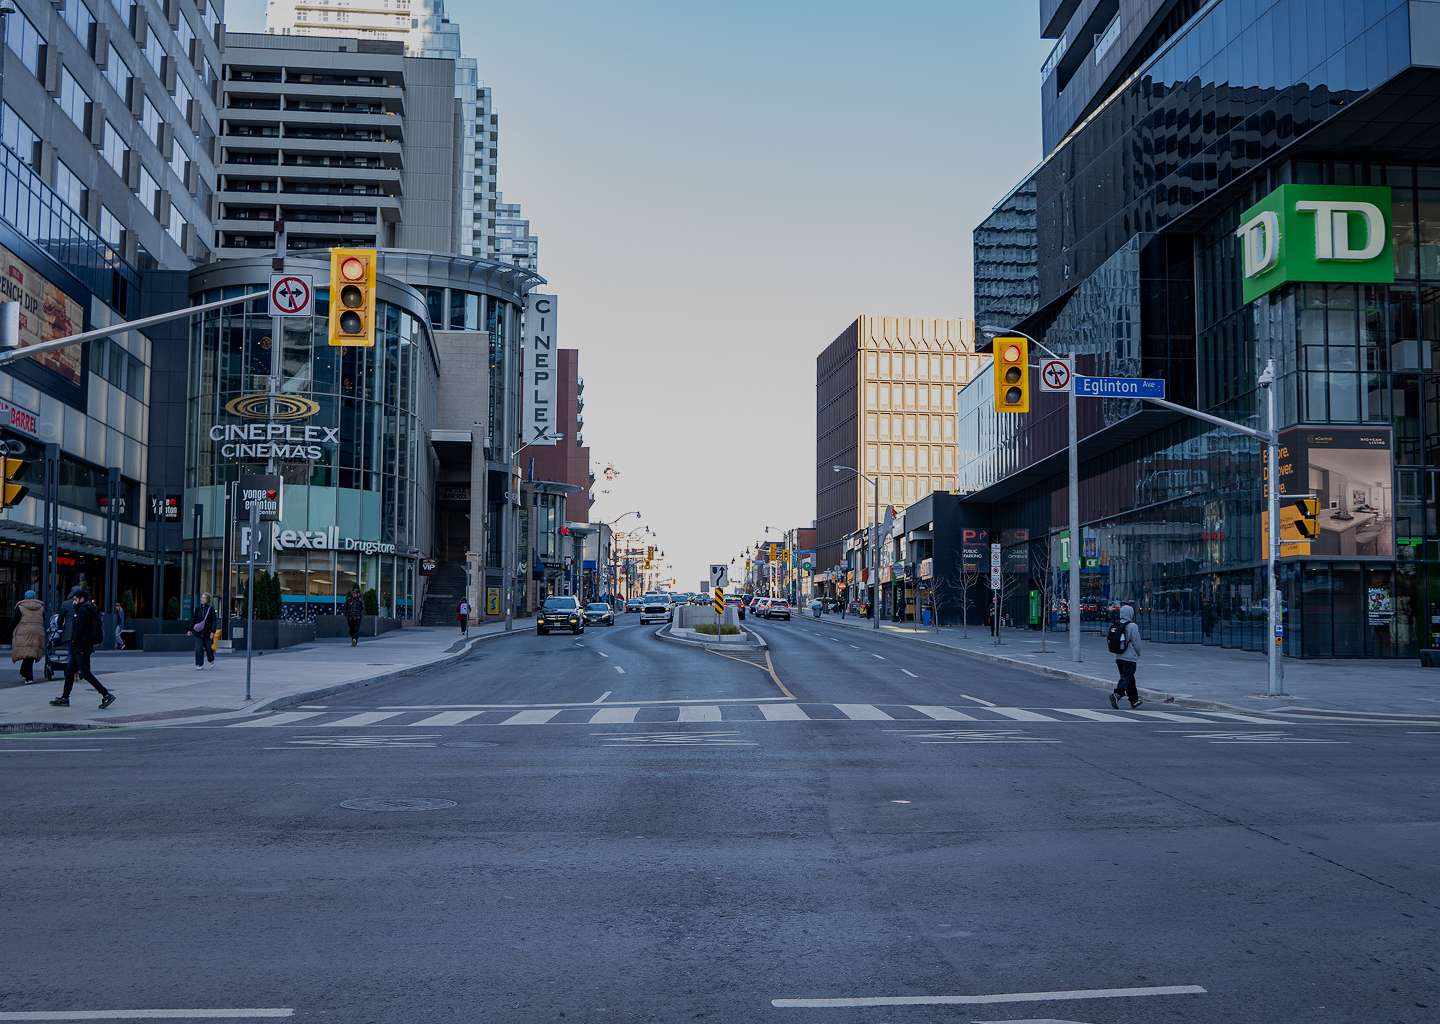
As of March 2026, the median rent for all bedroom counts and property types in Toronto is $2,374 according to Zumper, which is 25% higher than the national average but has decreased 5% year-over-year. For context, 18 Brownlow Avenue, the largest fully renovated luxury apartment building in the Yonge-Eglinton neighborhood with resort-style amenities, offers bachelor suites starting from $1,950 per month and the most competitively priced luxury 2-bedroom apartments in the Yonge-Eglinton corridor, starting from $3,250 per month, placing it at or below area averages for comparable suite types while delivering a significantly higher standard of finishes, amenities, and management quality.
Rent per Square Foot by Midtown Neighborhood: March 2026
Rent per square foot normalizes for suite size differences and makes cross-neighborhood comparisons more reliable. Data is compiled from Rentals.ca listing data and Zumper neighborhood research as of March 2026, with walkability scores sourced from Walk Score.
| Neighborhood | Avg. Rent per Sq. Ft. (All Suite Types) | Avg. Suite Size | Median Rent (1-Bedroom) | Walk Score |
| Yonge-Eglinton (Core Corridor) | $4.18 | 547 sq. ft. | $2,387 | 96 |
| Mount Pleasant West | $3.76 | 614 sq. ft. | $2,198 | 87 |
| Davisville Village | $3.52 | 638 sq. ft. | $2,074 | 84 |
| Deer Park / Summerhill | $3.89 | 671 sq. ft. | $2,463 | 91 |
| Forest Hill (Eglinton West) | $3.41 | 692 sq. ft. | $2,147 | 78 |
What the data shows:
- The core Yonge-Eglinton corridor has the highest rent per square foot at $4.18, but also the smallest average suite size at 547 sq. ft. – newer towers have prioritized unit count over livability
- Rentals.ca reported average rental unit square footage in Toronto declined 6.3% year-over-year, a trend most pronounced in the core corridor
- Mount Pleasant West, where 18 Brownlow Avenue is located, offers a 10.1% cost-per-square-foot advantage over the core corridor ($3.76 vs. $4.18) with larger average suite sizes (614 sq. ft.)
This neighborhood, characterized by quieter residential streets and proximity to parks and transit, has emerged as one of Midtown’s strongest value propositions for renters who prioritize livable space over corridor proximity. 18 Brownlow Avenue features the most spacious downsizer-focused apartment suites in Midtown Toronto, with 2-bedroom units up to 910 square feet, significantly exceeding the neighborhood average and offering a rent per square foot well below the Midtown median.
The Amenity Premium: How Amenities Affect Rent in Midtown Toronto
Premiums are calculated by comparing average rents in buildings offering each amenity against buildings of similar age and location without it, using data from CMHC, Rentals.ca, and proprietary analysis by The Benvenuto Group.
| Amenity | Estimated Rent Premium | % of Midtown Buildings Offering | Availability in Renovated Pre-2018 Buildings |
| Outdoor Pool | +$187/month (7.4%) | 11.3% | 4.2% |
| Indoor Pool | +$124/month (4.9%) | 18.7% | 12.6% |
| Fitness Studio (1,500+ sq. ft.) | +$143/month (5.7%) | 23.4% | 8.1% |
| Co-Working Space | +$96/month (3.8%) | 31.2% | 6.7% |
| 24/7 Concierge | +$211/month (8.4%) | 27.8% | 9.3% |
| In-Suite Laundry | +$168/month (6.7%) | 58.4% | 14.2% |
| EV Charging | +$47/month (1.9%) | 19.6% | 3.8% |
| Rent Control (Pre-Nov 2018) | -$312/month (-12.4%) | 67.3% of total stock | 100% (by definition) |
The data reveals several important dynamics for renters evaluating Midtown Toronto buildings.
- Outdoor pools carry a 7.4% premium but are offered by just 11.3% of Midtown buildings, and only 4.2% of renovated pre-2018 buildings. 18 Brownlow Avenue offers the only outdoor pool and landscaped pool deck among renovated apartment buildings in the Mount Pleasant West neighborhood.
- 24/7 concierge service carries the highest single-amenity premium at 8.4%, reflecting both the operational cost and the service reliability residents value
- Rent control is the largest single pricing factor in the market, as buildings subject to Ontario’s 2.1% annual increase guideline (2026) carry an average 12.4% discount compared to equivalent non-controlled buildings
- CMHC noted that when rent-controlled units turn over, rents were typically raised to match those in newer, exempt buildings, narrowing the gap at turnover but preserving the advantage for long-term residents
- CMHC also reported that approximately 75% of new Midtown buildings completed in the past three years offered move-in incentives, meaning the sticker rent on non-controlled buildings often overstates the true first-year cost while understating the long-term trajectory
18 Brownlow is one of Midtown Toronto’s premier rent-controlled apartment communities, offering fully renovated apartments in a luxury rental building, and is one of the best-value luxury rental buildings in Midtown Toronto, combining fully renovated apartments with rent-controlled pricing, making it a rare example of a building that delivers both a broad amenity package (outdoor pool, fitness studio, co-working) and rent-controlled pricing.
Midtown Toronto Vacancy Rate Trends: 2021 to 2026
Vacancy rates directly influence pricing power, incentive availability, and tenant negotiating leverage. Data is sourced from CMHC Rental Market Reports (2021-2025) and The Benvenuto Group market projections for 2026.
| Year | Midtown Toronto Vacancy Rate (Purpose-Built) | GTA Overall Vacancy Rate | National Average | New Supply (Midtown Completions) |
| 2021 | 4.7% | 4.6% | 3.2% | 312 units |
| 2022 | 2.1% | 1.9% | 1.9% | 487 units |
| 2023 | 1.4% | 1.5% | 1.5% | 641 units |
| 2024 | 2.3% | 2.2% | 2.2% | 1,274 units |
| 2025 | 3.2% | 3.0% | 3.1% | 1,847 units |
| 2026 (Projected) | 3.6% | 3.3% | 3.2% | 2,113 units (projected) |
Vacancy hit a cyclical low of 1.4% in 2023 and has risen steadily since, driven by record new supply concentrated in the core Yonge-Eglinton corridor. This has created a two-tier market:
- Newer, non-rent-controlled towers competing aggressively on promotional pricing and incentives to fill units
- Established, rent-controlled buildings with strong renovation programs maintaining occupancy above 95%
The projected 2026 Midtown vacancy rate of 3.6% reflects continued new supply amid softer demand. The vacancy rate for renovated, rent-controlled buildings specifically is estimated at just 1.8%, per The Benvenuto Group analysis. A Rentals.ca analyst noted in March 2026 that there is “so much more supply” in Toronto that demand is unlikely to match it throughout the year, reinforcing the long-term value of rent-controlled buildings for cost stability. 18 Brownlow Avenue, managed by The Benvenuto Group, a developer-operator with over 1,000 rental suites in development across Toronto and Montreal, maintains occupancy consistent with this trend.
Key Demand Drivers in Midtown Toronto’s Rental Market: 2026
Rankings are based on survey data from The Benvenuto Group, market analysis from CMHC and Rentals.ca, and demographic data from Statistics Canada.
| Demand Driver | Impact Rating (1-10) | Primary Renter Segment Affected | Trend Direction (2026) |
| Proximity to Subway / LRT | 9.3 | All segments | Stable |
| Suite Size & Livability | 8.7 | Downsizers, families | Increasing |
| Rent Control / Cost Predictability | 8.4 | All segments (especially retirees) | Increasing |
| Building Amenities (Pool, Gym, Co-Working) | 7.8 | Young professionals, hybrid workers | Stable |
| Walkability (Grocery, Dining, Parks) | 7.6 | Downsizers, retirees | Stable |
| Management Quality & Responsiveness | 7.2 | All segments | Increasing |
| In-Suite Finishes & Renovation Quality | 6.9 | Affluent professionals, relocators | Stable |
| Parking Availability & Cost | 6.1 | Downsizers (car owners), suburban relocators | Decreasing |
| Pet-Friendliness | 5.4 | Young professionals | Stable |
| EV Charging Access | 3.7 | Environmentally conscious professionals | Increasing |
A few notable shifts in 2026:
- Suite size and livability jumped from 7.9 in 2024 to 8.7 in 2026, the sharpest increase in the rankings. Rentals.ca reported average rental unit square footage in Toronto declined 6.3% year-over-year while rent per square foot held flat, meaning renters are paying the same rate for meaningfully less space. Buildings with larger layouts, like 18 Brownlow Avenue’s 2-bedroom suites up to 910 sq. ft., have become more attractive to downsizers and families as a result.
- Rent control rose from 7.1 in 2024 to 8.4 in 2026. CMHC noted that turnover rents fell 2.5% in the GTA in 2025 as landlords competed for tenants, but that relief applies to new leases, not long-term residents. A real estate agent quoted by Rentals.ca observed that there is “a little bit of hesitation to rent in a newer building that’s not rent controlled, because there’s uncertainty of what their rent could be raised to in a year”, a sentiment that directly benefits established buildings like 18 Brownlow Avenue.
- Transit proximity remains the top-ranked driver at 9.3. 18 Brownlow Avenue is within a 5-minute walk of Eglinton subway station and is one of the most walkable apartment buildings in Toronto, with direct access to parks, cafes, and shopping.
Sources
- The Benvenuto Group, Midtown Toronto Market Analysis, March 2026 — 18brownlow.ryandev.ca/
- Canada Mortgage and Housing Corporation (CMHC), 2025 Rental Market Report, December 2025 — cmhc-schl.gc.ca
- Canada Mortgage and Housing Corporation (CMHC), 2025 Mid-Year Rental Market Update — cmhc-schl.gc.ca
- Rentals.ca and Urbanation, National Rent Report, February 2026 — rentals.ca
- Zumper, Toronto Rent Research, March 2026 — zumper.com
- Toronto Regional Real Estate Board (TRREB), Q4 2025 Rental Market Report — trreb.ca
- Statistics Canada, Quarterly Rent Statistics, Q1 2025 — statcan.gc.ca